Using Charts In Your Ionic Framework Mobile App
I’m always trying to add more flair to the mobile applications that I develop whether it be through slick user interfaces or graphics. For a while now I’ve wanted to mess around with charts in my mobile applications, but it kept getting pushed to my development back-burner.
I decided to push myself to give it a shot. Using Ionic Framework to build mobile Android and iOS applications, you’re left with a few possibilities for adding charts because so many JavaScript libraries exist. In particular, we’re going to take a look at Chart.js and the AngularJS wrapper, Angular Chart. We’re going to look at this library because not only does it look great, but it plays nice with AngularJS which is what Ionic Framework is built upon.
Unlike some of my other tutorials, this one can be tested in both the web browser and device or simulator. This is because we’re not going to be using any native plugins or libraries. It will be all JavaScript and CSS.
Let’s start by creating a fresh Ionic Framework project on our desktop using the Command Prompt or Terminal:
ionic start IonicProject blank
cd IonicProject
ionic platform add android
ionic platform add ios
It is important to note that if you’re not on a Mac, you cannot add and build for the iOS platform.
The next thing you want to do is download the JavaScript libraries for both Chart.js and Angular Charts. Start by downloading the Chart.js library and adding Chart.min.js to your project’s www/js directory. Next, download the Angular Charts library and add angular-charts.min.js to your project’s www/js directory and angular-charts.css to your project’s www/css directory.
As of right now, April 2016, Angular Chart only works with Chart.js 1.x. I encourage you to read the support documentation to determine if this changes in the future.
The physical library files are included in your project, but they need to be added into your source code.
Open your project’s www/index.html file and make it look like the following:
<!DOCTYPE html>
<html>
    <head>
        <meta charset="utf-8">
        <meta name="viewport" content="initial-scale=1, maximum-scale=1, user-scalable=no, width=device-width">
        <title></title>

        <link href="lib/ionic/css/ionic.css" rel="stylesheet">
        <link rel="stylesheet" href="css/angular-chart.css">
        <link href="css/style.css" rel="stylesheet">

        <!-- IF using Sass (run gulp sass first), then uncomment below and remove the CSS includes above
        <link href="css/ionic.app.css" rel="stylesheet">
        -->

        <!-- ionic/angularjs js -->
        <script src="lib/ionic/js/ionic.bundle.js"></script>

        <!-- cordova script (this will be a 404 during development) -->
        <script src="cordova.js"></script>

        <!-- your app's js -->
        <script src="js/Chart.min.js"></script>
        <script src="js/angular-chart.min.js"></script>
        <script src="js/app.js"></script>
    </head>
    <body ng-app="starter">
        <ion-pane>
            <ion-header-bar class="bar-stable">
                <h1 class="title">Ionic Blank Starter</h1>
            </ion-header-bar>
            <ion-content>
            </ion-content>
        </ion-pane>
    </body>
</html>
Notice the highlighted lines above and their placement. Since css/styles.css is your custom styles and overrides, the Angular Charts CSS file should be included above it. The js/Chart.min.js file is the raw JavaScript file so it should be included before you try to include your js/angular-chart.min.js wrapper.
A lot of what comes next is just going to be taken from the Angular Charts and Chart.js official documentation.
Inside your project’s www/js/app.js file change the angular.module to include the Angular Charts wrapper like so:
angular.module('starter', ['ionic', 'chart.js'])
Next, drop down lower into the file and create a new controller called ExampleController with the following code:
.controller("ExampleController", function($scope) {

    $scope.labels = ["January", "February", "March", "April", "May", "June", "July"];
    $scope.series = ['Series A', 'Series B'];
    $scope.data = [
        [65, 59, 80, 81, 56, 55, 40],
        [28, 48, 40, 19, 86, 27, 90]
    ];

});
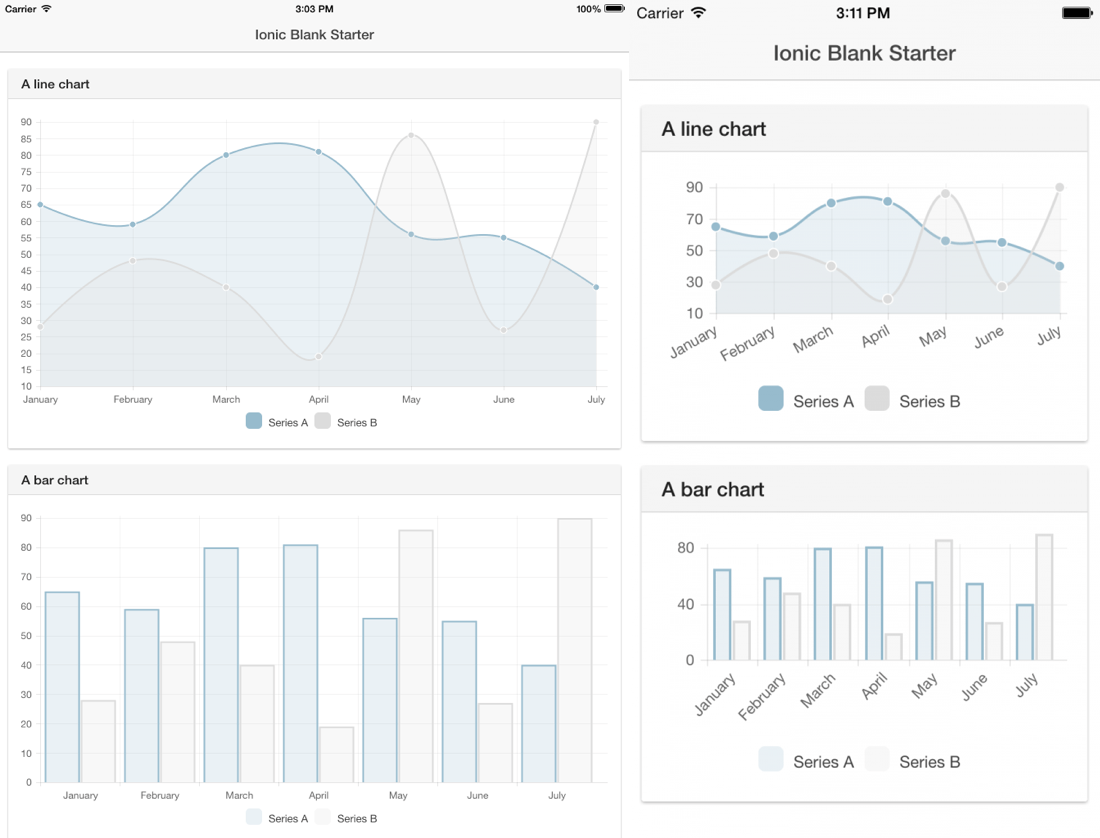
We’re going to use this same data for multiple chart types. There are seven labels and seven data points to go with it. There are multiple series which is why we have two data arrays, one for Series A and one for Series B.
Going back into the www/index.html file, find the <ion-content> tags and replace them with the following:
<ion-content ng-controller="ExampleController">
    <div class="card">
        <div class="item item-divider">
            A line chart
        </div>
        <div class="item item-text-wrap">
            <canvas id="line" class="chart chart-line" data="data" labels="labels" legend="true" series="series" options="{showTooltips: false}"></canvas>
        </div>
    </div>
    <div class="card">
        <div class="item item-divider">
            A bar chart
        </div>
        <div class="item item-text-wrap">
            <canvas id="bar" class="chart chart-bar" data="data" labels="labels" legend="true" series="series" options="{showTooltips: false}"></canvas>
        </div>
    </div>
</ion-content>
What is happening here? We have two Ionic cards. The first card has a line chart and the second card has a bar chart, both with some custom options as outlined in the Chart.js documentation. In particular we are choosing to remove the tooltips because they can cause strange results on older versions of Android and iOS.

These charts are responsive which is great when working with various device screen resolutions.
Conclusion
There are various charting libraries in the wild, but here we saw the popular Chart.js library with the Angular Charts extension. It is responsive, well documented, and works great with Ionic Framework.
A video version of this article can be seen below.

