Debugging Your Android Source Code With ADB
Debugging your source code is a critical part of any application development process and Android is no exception.
A lot of people post comments or email me asking me to help them with their application that isn’t working. The first thing I try to ask for are the log files. I do this because 90% of the time, the log files have an error message that tells us exactly what line the error is on.
For Android development, we are lucky enough to have a fantastic debugging tool shipped with the SDK. The Android Debug Bridge (ADB) is a command line interface that has the power to tell us exactly what our app is doing inside a simulator or device. It is not restricted to telling just what our app is doing, but what the whole device and what every app on the device is doing.
Everything after this point will assume that you have the Android SDK installed and configured correctly. If you’re using Ubuntu Linux, I have a script that will do this all for you. It can be seen in one of my previous articles. If you’re using Mac or Windows and are not set up, I suggest a few Google searches on the topic.
We will be using the following command:
adb logcat
If you want to keep up with the internet memes, Google included the ability to run the logging software with the following command as well:
adb lolcat
The above commands are very powerful to developers. You can use it to debug native Android applications as well as hybrid Android applications created with frameworks such as Phonegap or Ionic.
To keep things diverse, I’m going to demonstrate how to debug both native and hybrid Android applications.
Native Android
Let’s start by creating a fresh Android application from the command line:
android create project --target 19 --name TestProject --path ./TestProject --activity TestProjectActivity --package com.nraboy.testproject
Now we need to open the freshly created project and add some terrible code. Java is an unforgiving language so we can’t really add randomness and hope it passes the compile phase. We need to be able to establish a run time error only and not compile time error. Open your src/com/nraboy/testproject/TestProjectActivity.java file and make it look like the following:
package com.nraboy.testproject;

import android.app.Activity;
import android.os.Bundle;
import java.util.ArrayList;

public class TestProjectActivity extends Activity
{

    ArrayList<String> testList;

    /** Called when the activity is first created. */
    @Override
    public void onCreate(Bundle savedInstanceState)
    {
        super.onCreate(savedInstanceState);
        setContentView(R.layout.main);
        testList = new ArrayList<String>();
        testList.remove(0);
    }
}
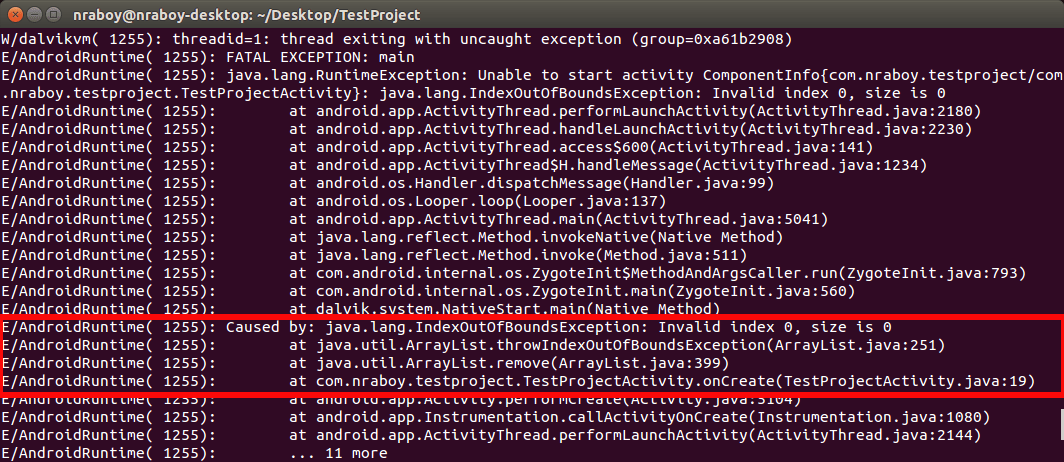
I went ahead and created a new ArrayList and then tried to delete from it. Because there are no items in the list prior to trying to delete, it will throw an index out of bounds error. With logcat running, launch the application and you should see something like the following:

Notice that the Terminal not only displays the file that the error occurred in, but it also tells us the line number. This information paired with the type of error should be enough to resolve the issue.
Hybrid Android – Ionic Framework
Let’s start by creating a fresh Ionic Framework application from the command line:
ionic start TestProject blank
cd TestProject
ionic platform add android
Now we need to open our project and add some bad code. It is easier to create bad code in a hybrid application because JavaScript is way more forgiving than Java. With that said, crack open app.js and make your file look similar to the following:
var example = angular.module('starter', ['ionic']);

example.run(function($ionicPlatform) {
    $ionicPlatform.ready(function() {
        if(window.cordova && window.cordova.plugins.Keyboard) {
            cordova.plugins.Keyboard.hideKeyboardAccessoryBar(true);
        }
        if(window.StatusBar) {
            StatusBar.styleDefault();
        }
        alert("It will error " + myVariable.run);
        console.log("See Above");
    });
});
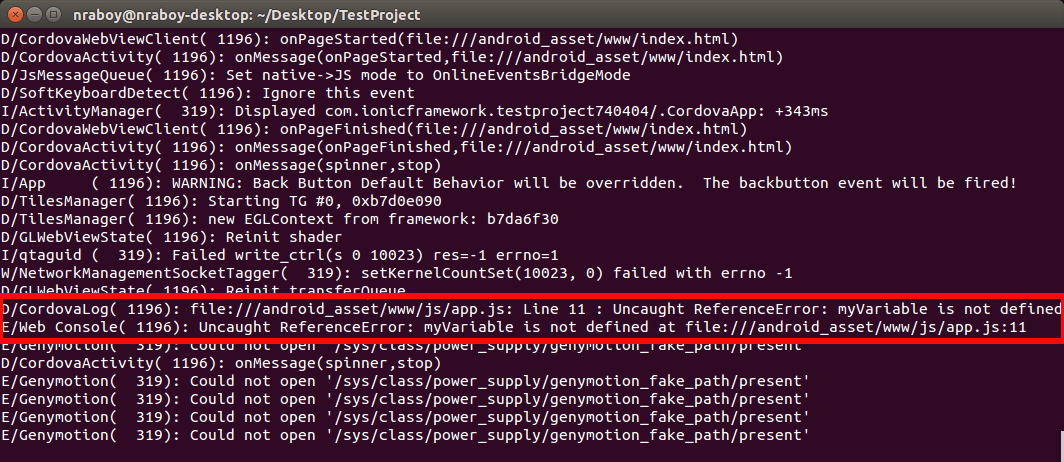
Variable myVariable doesn’t exist so we’d be trying to access the run element on a null object thus throwing an error. If this were native Java it probably wouldn’t compile, but since it’s JavaScript, the compile process won’t even check. When trying to launch the application with logcat running you should see the following in your Terminal:

Now I’m sure you’re probably going to come up with nastier errors than I did in my example, but at least you’ll have a good idea on what to look for. You’ll notice in the above error it tells us the exact file and line to look at. With that kind of information it should only take seconds to correct.
Conclusion
It doesn’t matter if you’re building native Android applications or hybrid Android applications, the ADB utility will help you debug your application quickly and easily. Yes the errors can be tricky to see in logcat, but after you catch a few of them and you know what to look out for, they should become easier to spot.
A video version of this article can be seen below.

